Outlier
outlier is a point for which is far from the value predicted by the model.
B) Outlier 판단 하기
B.1) Using standardization
A standard cut-off value for finding outliers are Z-scores of +/-3 or further from zero.
The probability distribution below displays the distribution of Z-scores in a standard normal distribution.
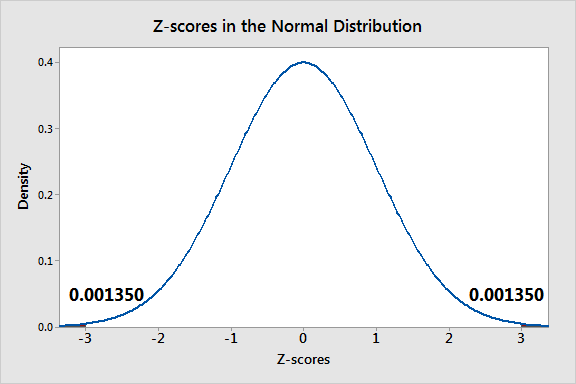
Z-scores beyond +/- 3 are so extreme you can barely see the shading under the curve.
B.1.1) 문제점
Z-scores can be misleading with small datasets because the maximum Z-score is limited to .
이면, Z-score 는 3 을 넘지 못한다.
B.2) Using Boxplot
boxplots display asterisks or other symbols on the graph to indicate explicitly when datasets contain outliers.
These graphs use the interquartile method with fences to find outliers.
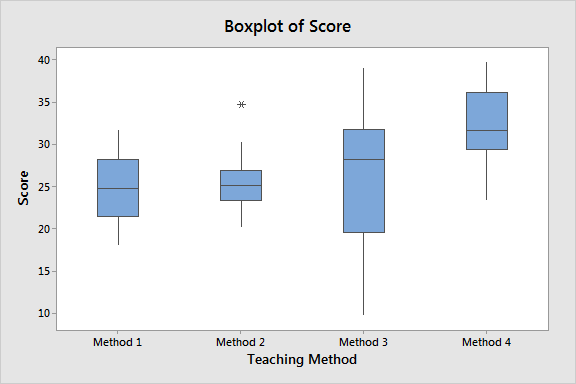
- The boxplot below shows a different dataset that has an outlier in the Method 2 group.
B.3) Using Residual Plot
- residual plots can be used to identify outliers.