Challenges of Linear Regression
linear regression 모델을 다룰 때 발생할 수 있는 이슈들
A.1) Non-linearity of the Response-predictor Relationships
- residual plot are a useful graphical tool for identifying non-linearity.
A.2) Correlation of Error terms
- An important assumption of the linear regression model is that the error terms, , are uncorrelated.
- if the error terms are correlated, we may have an unwarranted sense of confidence in our model.
A.3) Non-constant variance of Error terms
- Another important assumption of the linear regression model is that the error terms have a constant variance,
- error term 에 대한 variance 들이 non-constant 한 현상을 heteroscedasticity 라고 부른다.
- 이 현상에서는 주로 residual plot 에서 꼬깔콘 (funnel) 모양이 나오는 것으로 확인할 수 있다.
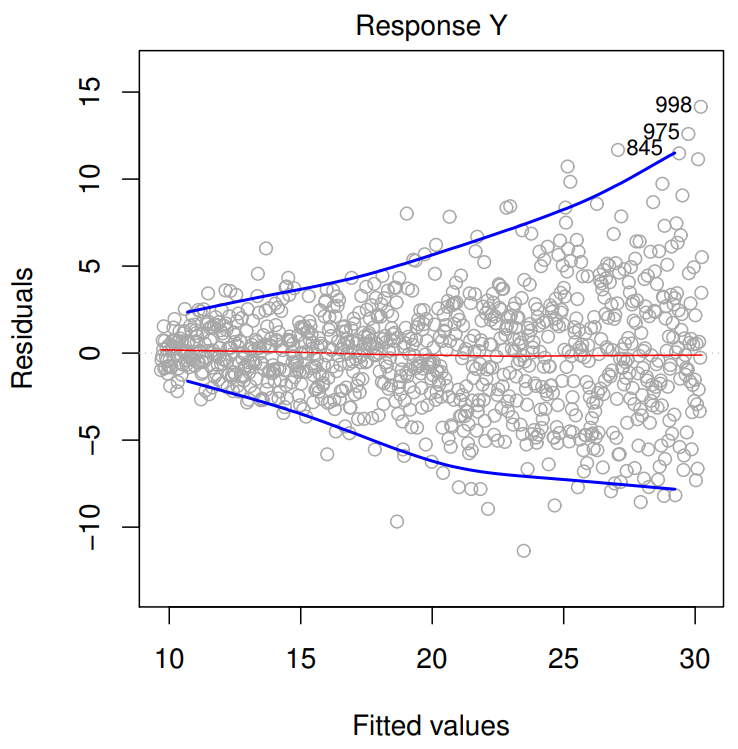
- response 값이 점점 커질수록 잔차가 커진다는 의미인데, 이럴 경우 또는 를 적용해서 이러한 현상을 완화할 수 있다.
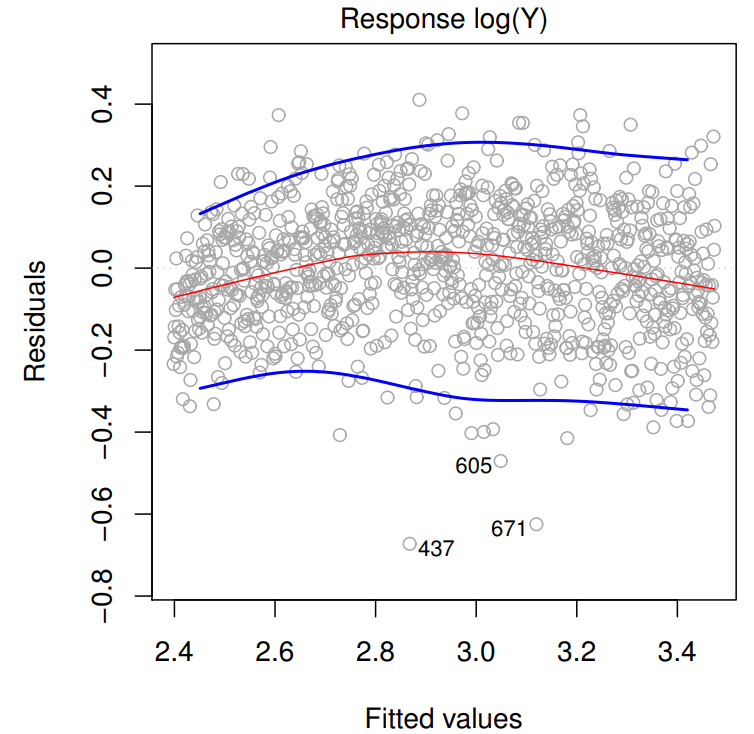
- 이 현상에서는 주로 residual plot 에서 꼬깔콘 (funnel) 모양이 나오는 것으로 확인할 수 있다.
A.4) Outlier
- outlier 자체가 [least squares](least squares estimation) 를 통해 생성한 모델에는 큰 영향을 주지 않을 수 있다.
- 하지만, 단일 outlier 자체가 [RSE](residual standard error) 값을 크게 바꾸기 때문에, 모든 confidence interval 과 p-value 계산에 큰 영향을 줄 수 있다.
- 결과적으로, 학습된 모델의 해석에 암묵적인 (implication) 어려움을 줄 수 있는 것이다.
- residual plots can be used to identify outliers.
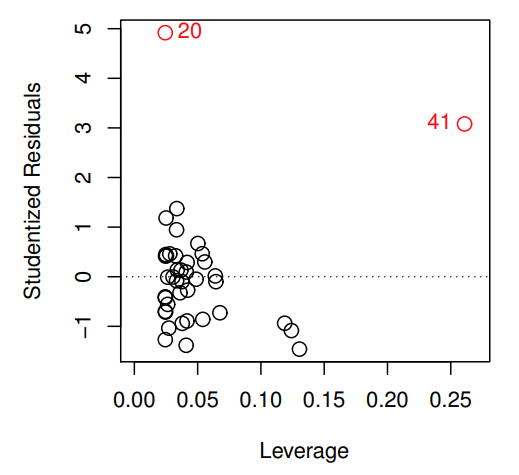
- 그러나 이 방법보다는 studentized residuals 을 그려봄으로써 outlier 를 찾을 수 있다.
- Observations whose studentized residuals are greater than 3 in absolute value are possible outliers.
- High-leverage points
- outlier 와 비슷한 개념이지만, model 형성에 큰 영향을 준다는 점이 다르다.
- outlier 의 경우 model 학습에 큰 영향을 주진 않지만, 해석 (interpretation) 에 영향을 줄 수 있다.
- 그러나 high-leverage 를 지닌 observation 은 model 학습에 큰 영향을 준다.
- observation 의 leverage 를 측정하기 위해서는 leverage statistic 을 계산해야 한다.
- A large value of this statistic indicates an observation with high leverage.
- outlier 와 비슷한 개념이지만, model 형성에 큰 영향을 준다는 점이 다르다.
A.5) Collinearity
the situation in which two or more predictor variables are closely related to one another.
Since collinearity reduces the accuracy of the estimates of the regression coefficients , it causes the standard error for to grow.
collinearity results in a decline in the t-statistic. Because t-statistic for each predictor is calculated by dividing by its standard error.
- t-statistic이 줄어들면, 주어진 데이터가 선형 모델로 표현될 수 없다는 [[null hypothesis]] $H_{0}:\beta_{j}=0$를 기각하기 어려워진다.
- collinearity 를 판단하는 방법은 correlation matrix 를 이용하면 되지만, 세 개 이상의 변수가 correlated 하다면, 발견해내기 힘들다.
- 이 경우, variance inflation factor 를 활용해서 multicollinearity 를 판단한다.