Problem Statement of the Anomaly Detection
B) Anomaly Detection Example
- Fraud Detection
- is features of user ‘s activities
- Model from data: 인 경우를 체크하여 비정상적인 활동을 감지
- Monitoring computers in a data center
- is features of machine
- : 메모리 사용량, : 초당 디스크 액세스 횟수 …
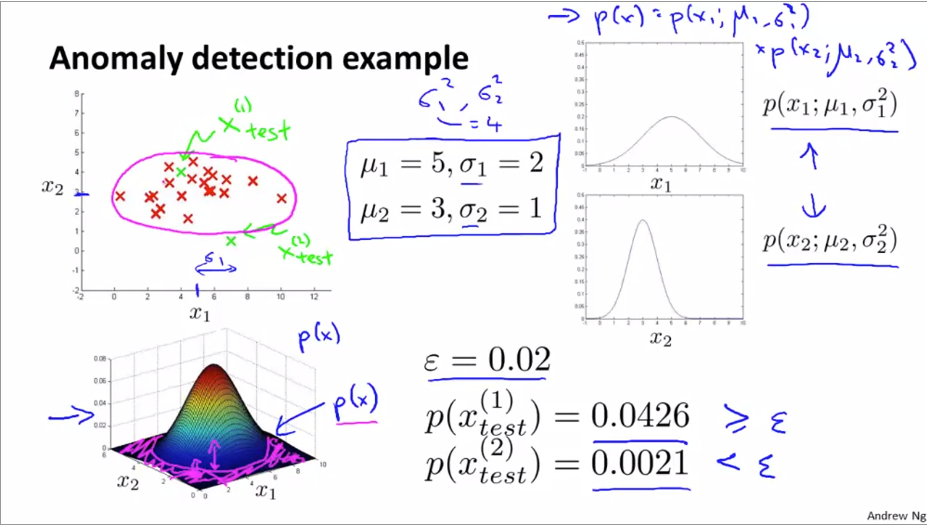
C) Parameter Estimation
주어진 데이터셋 에 대하여 [가우시안 분포](Gaussian distribution)에 대한 parameter들(, ) 을 예측하는 것
데이터셋이 너무 적으면, 에서 대신, 를 사용하기도 한다 (거의 차이가 없음).
D) Density Estimation
학습 데이터: (Each example is ) 가 주어졌을 때, 를 추정하는 방법
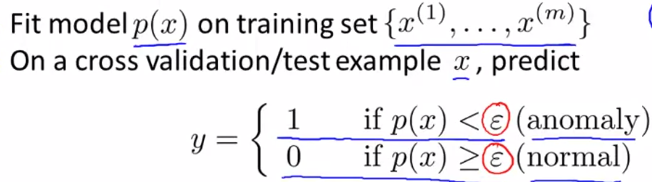
E) Anomaly Detection Algorithm
-
anomalous 의 기준이 된다고 생각하는 features 를 고른다.
-
parameter 학습 (계산):
-
새로운 example 가 주어졌을 때, 를 계산한다.
- 만약 이면 anomaly 이다.
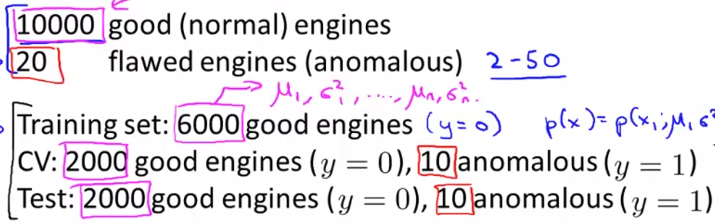
F) Anomaly Detection System 을 구성하기 위한 단계
- 우선 정상적인 (not anomalous) 학습 데이터들을 이용하여 를 찾는다.
- label 된 cross-validation set 으로 시스템을 평가하여 성적이 좋은 모델만 추려낸다.
- 마지막으로 test set 으로 평가
G) Evaluating an Anomaly Detection System
accuracy 와 같은 평가 방법은 좋지않다. 왜냐하면 cross-validation set 과 test set 의 anomalous 비율이 normal 에 비해 매우 작으므로 올바른 성능을 평가하기 힘들기 때문이다.
- 추천하는 evaluation metrics: precision, Recall, F1 Score
- 평가 이후, threshold 을 계산할 수 있는데, 그 이유는 높은 성능을 내는 system 이 사용한 을 찾으면 되기 때문이다.
- anomaly detection vs supervised learning
- Anomaly Detection 를 사용하면 좋을 경우
- positive examples 에 대한 데이터 수가 매우 작고, negative examples 이 매우 많을 경우
- positive 는 normal 현상, negative 는 anomalous 현상
- positive examples 에 대한 데이터 수가 매우 작고, negative examples 이 매우 많을 경우
- Supervised Learning 를 사용하면 좋을 경우
- positive 와 negative 둘 다 데이터 수가 충분히 많을 때
- 세상에는 매우 많은 종류의 anomalies 가 존재한다.
- 모델이 학습한 데이터에 대한 anomalies 는 이후 anomalies 와 많이 다를 수 있다.
- Anomaly Detection 를 사용하면 좋을 경우
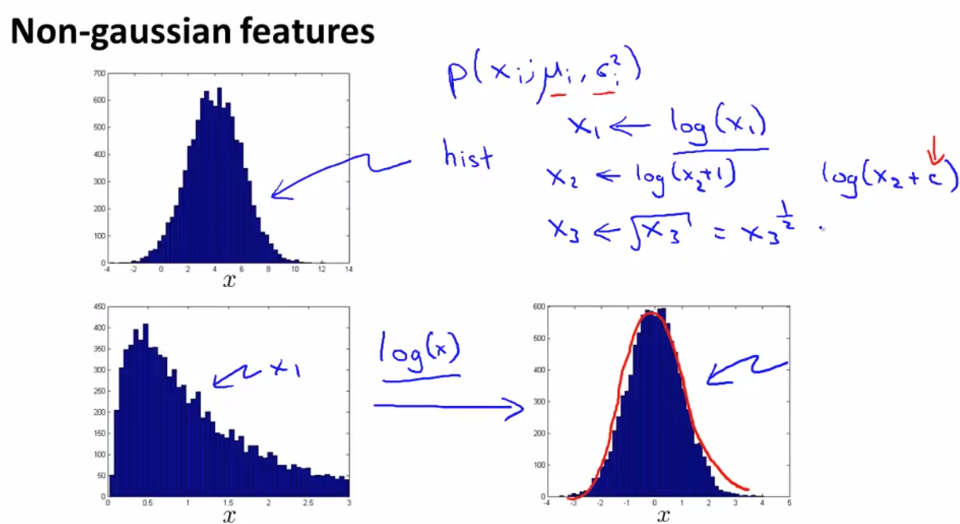
- Gaussian distribution 이 아닌 데이터를 Gaussian distribution 형태로 맞추는 방법
- log, sqrt 등 을 활용하면 된다.
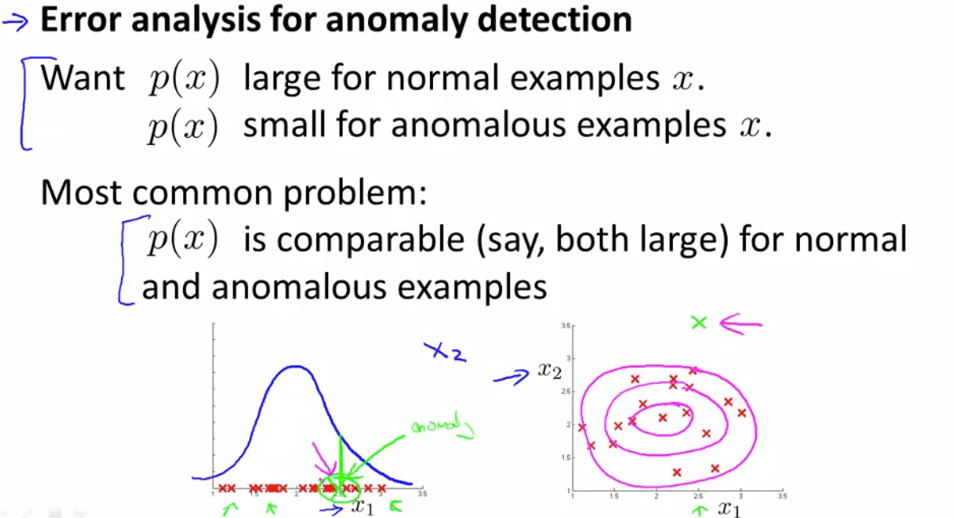
- Error analysis for anomaly detection
- normal examples 이 많고, anomalous example 수는 적을 때, anomaly 데이터인데도 불구하고 normal 로 처리해버리는 모델들이 있다.
- 그럴 때는 새로운 feature 들을 추가해서 detection 의 성능을 향상시킨다.
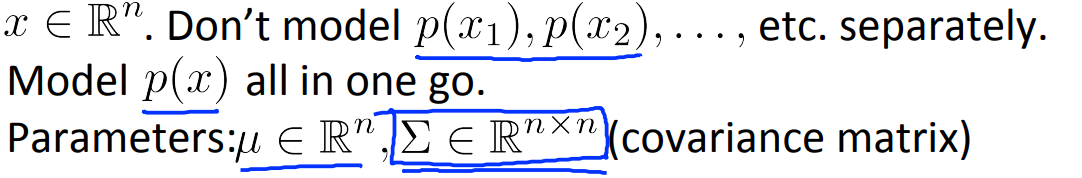
- Multivariate Gaussian distribution
- 각 차원에 대한 개별적인 gaussian distribution model 을 만드는 것은 좋지 않다.
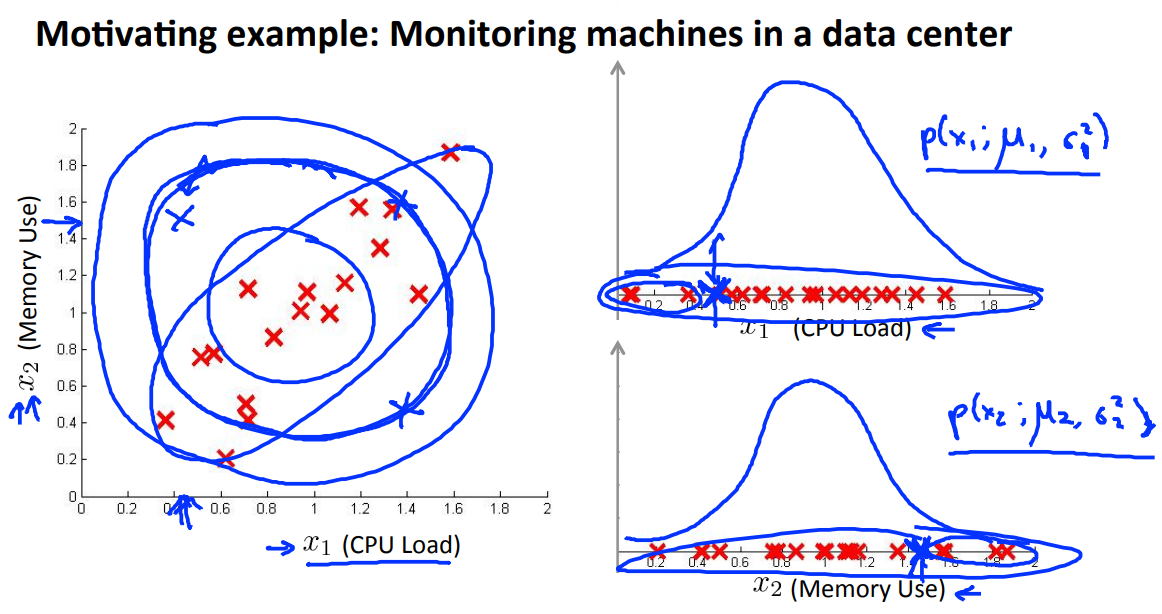
위 그림에서 왼쪽 위에 있는 x 표시의 example 은 2 차원에서는 anomaly 인데도 불구하고, 각 과 에서는 normal example 로 분류된다.
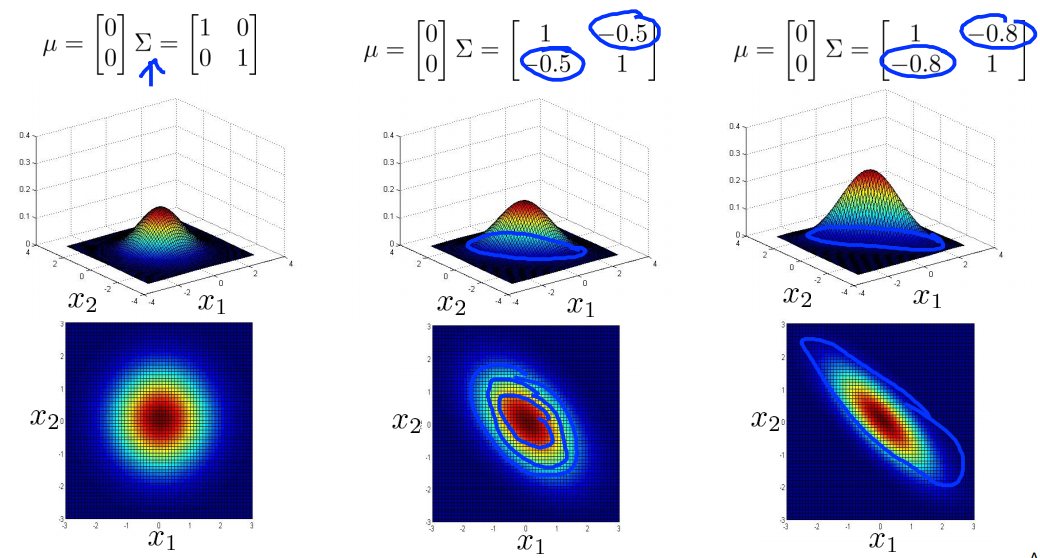
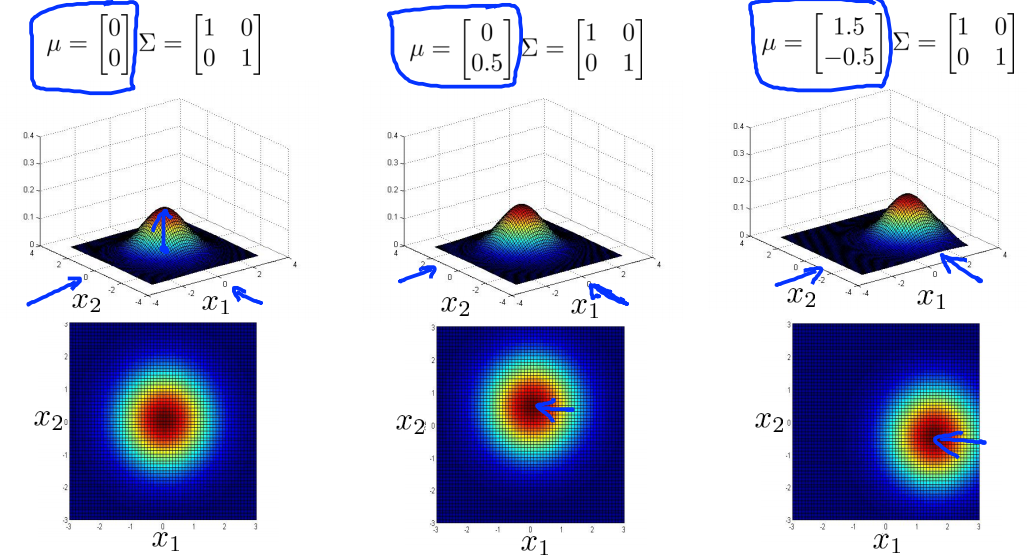
- Multivariate Gaussian Normal distribution 은 모든 차원의 gaussian model 을 하나로 관리한다.
얻어진 와 는 값에 따라 아래 그림과 같은 모양을 가진다.
-
anomaly detection using the Multivariate Gaussian distribution
-
model 를 fit 한다.
-
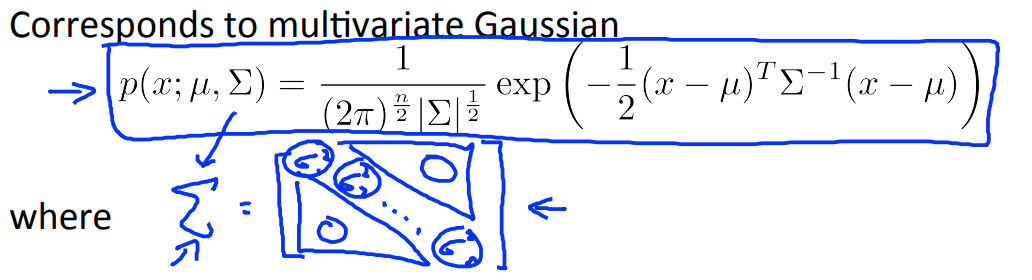
새로운 가 입력되면, 다음을 계산한다.
-
만약 을 만족하면, anomaly 이다.
-
Relationship between multivariate Gaussian distribution and univariate (original model)
사실 기존의 방식과 비교하면, 여러 모델의 확률을 곱한 것과 비슷하다.
완전히 같은 경우는 공분산 행렬 을 구했을 때, 대각선 성분 외에 나머지가 0 인 경우다. 이는 feature 간 linear independent 한 경우 관찰할 수 있다.
Original Model
H) Multivariate Gaussian
- anomaly 를 효과적으로 잡아내기 위해서, 수동으로 feature 를 만들어내야 함
- 공분산 행렬을 구함으로써, 자동으로 feature 간 관계를 찾아낼 수 있음
- 낮은 복잡도
- 높은 복잡도 (공분산 행렬 계산)
- training set size 이 적어도 괜찮음
- 을 계산해야 하기 때문에, 을 반드시 만족해야 하며, feature 간 linear independent 한 경우에도 이 존재하지 않을 수 있음